September 5, 2016
Grocon Safety Update September 2016
Dear Valued Clients and Partners
This is my first opportunity to write to you with an update of our Safety Performance. While I am very happy to provide you with our latest quarterly update I thought it might be helpful to put the update into a broader context.
Many organisations in our industry report their safety performance and they generally use a measure called “Lost Time Injury Frequency Rate” (LTIFR). In Australia we have a most unusual approach of enabling companies to report activity on their sites where they can choose to report only on their own staff and so avoid transparency about the safety of all of the other people who might be on the site or in the workplace. There is also variance with how the data is reported so that while it is best practice to report a Lost Time Injury (LTI) if it causes someone to miss a single shift or day, the Australian approach is to report LTI when the injury is such that is causes more than 5 shifts, or days, to be lost. In other words, if someone is injured and is away from work for less than five days then that LTI is not reported as a lost time injury in the official Australian data and/ or if someone is injured but is a sub-contractor or visitor then they may not be recorded by the reporting company at all. To us this is absurd and, as if to highlight that absurdity, it is nowhere near World’s Best Practice reporting.
Grocon continues to track our performance and to report using the DuPont approach to World’s Best Practice reporting. This approach requires that any site be considered inclusive of anyone and everyone who enters the site – be they consultants, sub-contractors, visitors or employees. We also report on the measure that any lost time of one day or more is a lost time injury. We committed to taking this approach in 2009 when we began working with DuPont as our safety consultants. With DuPont we reviewed all of our processes and procedures. We established a central safety committee chaired by our CEO and with very senior team members at the table. We cascaded that approach down through the organisation and we set about targeting zero harm. We also enabled our team members to take a role in safety – through both their own actions and their support of those around them. By reporting deeply, accurately and often we began to fully understand the causes of injuries and we developed plans to remove those causes and to become safer. Along the way we engaged with authorities, both State and Federal, to develop industry leading (and subsequently national all-industry award winning) plans and management structures to dramatically improve workplace health and safety throughout our organisation and our activities.
I am pleased to have joined a company with such a strong focus on safety. The drive that I have found here to keep improving and to attain the zero harm objective resonates through every part of the business that I have visited.
Because our reporting includes all people who attend our sites I know that in one way or another it is likely that members of your team have been part of this journey with us. I take this chance to both thank you for joining us in this drive and to entreat you to keep the focus with us because, by working together in a partnership, we can keep our people safe.
Now to our detailed results in the past quarter.
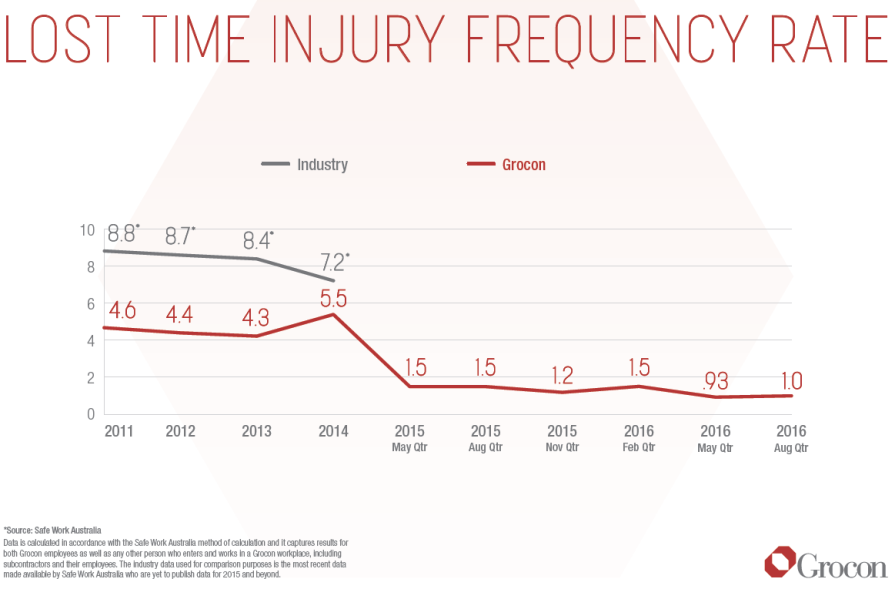
In early August we reached the milestone of 1,000,000 hours of work at our Parklands project on the Gold Coast and at the time of the one millionth hour being delivered we had recorded 1 lost time injury – a remarkable effort and credit to the whole team on that project on delivering such a low injury rate. But there is more to do and, with fit out and an increase in the number of people on site at Parklands, there is a need for ongoing vigilance. In the graph below you will observe a lost time injury frequency of 1.0. Note however that to compare the performance with the Australian data the performance graphed relates to the national approach. Were we to report our performance in this graph using the international standard then our reported LTIFR would be 1.4. It is impossible to advise how much higher the national number would be and, in our view, that is something that must change.
You will also see:
- A slight increase of 0.07 on the May quarter but, in effect, these two quarters are at remarkably low levels,
- That there has been no new data from Safe Work Australia on the industry rate since 2014 and this reflects their reporting every two years – so we will see the grey “Industry” line on this graph extend at year’s end, and
- That the sustained effort over the past twelve months has had a very significant impact.
Maintaining a low Injury Frequency Rate is a strong indicator of performance and we are very focused on continuing this strong performance. Having said that we would prefer it were zero and continue to work towards that goal.
We’ve reported to you before on the topic of safety and we will do so again. We are committed to open and transparent reporting and to making that reporting as accurate and holistic as possible. So when next you are considering the safety statistics being reported to you I suggest that you might pause to consider whether or not the report that you are being shown is really reflective of the conditions on the site in question. You might question whether the data reports only on the staff of the reporting company or whether it includes all people who attended that site. You might ask if the report reflects LTIFR measured on every shift/day or just the measure that suggests a lost time injury only exists if more than 5 shifts/days and you might ask how the data compares with past performance and the Safe Work Australia reports? In asking these questions and seeking to make a workplace culture that is safe for everyone we can make a difference and we can achieve World’s Best Practice. But if we don’t report that way you can bet that we’ll never get the whole industry there.
If at any time you would like more information about Grocon’s safety performance or advice on how and why we measure things the way we do then please don’t hesitate to contact us.
Regards,
Craig